Summary indexing is a process that allows you to search large datasets more efficiently by creating smaller, customized summaries of those datasets to search instead.
Because these new summary indexes have significantly fewer events for your Splunk software to search through, searches run against them complete much faster.
In this article, we’ll breakdown everything you need to know about summary indexes in Splunk, including:
- What is a summary index?
- How do summary indexes affect licensing?
- How do you create a summary index?
- A step-by-step example of creating and running a summary index
What is a Summary Index?
A summary index is an index that summarizes a larger dataset over time by extracting and storing only the most relevant pieces of data. This allows you to conduct quicker, more efficient searches.
The most common use cases for summary indexes include running reports over long time ranges for large datasets as well as building rolling reports.
Summary indexes are no different than other indexes; however, an advantage of using summary indexes is that you can modify retention times for the data.
Consider, for instance, that the source of your data is in an index with a 90-day retention time. By moving key pieces of data to a separate index, you can keep them for a longer time while saving on disk space.
By default, Splunk provides an index named “summary,” but you create additional summary indexes according to your needs.
How Do Summary Indexes Affect Licensing?
By default, all events in a summary index use the “stash” source type. Therefore, summary indexing does not count against your license, no matter how many summary indexes you have.
The only scenario in which licensing would be impacted is if you use commands like “collect” to change the source type to something other than “stash.”
How Do You Create a Summary Index?
The process to implement summary indexing is fairly straightforward:
- Identify the index that will hold the summarized data
- Identify your report requirements (what data to report on and how frequently)
- Create a scheduled savedsearch by following the below steps:
- Develop and test the query that you will use to populate the summary index
- Edit the query to include a summary indexing command.
- Schedule the query
- Enable summary indexing
- Develop and test a query to view the summary index results
How to Create a Summary Index: Step-by-Step Example
Let’s walk through the steps of using a summary index to summarize data found within the _internal index using the web interface.
Step 1: Identify the index that will hold the summarized data
For this example, we will use the default “summary” index.
Step 2: Identify the report requirements
Our goal for this report is to show the number of events that are indexed per sourcetype within the _internal index. We want the report to generate the data on an hourly basis.
Step 3: Develop and test the index-populating query
To develop the query that will populate the summary index, write a query similar to what you want to report on in the end. First take into account all fields you may want to include, then summarize the data using the stats command, and lastly test the output.
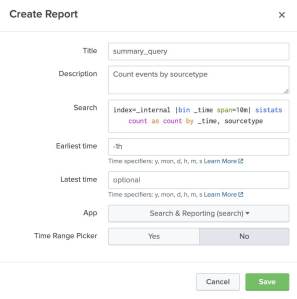
For this example, we want to count the number of events indexed per hour within the _internal index by sourcetype. Thus, our query will look like this:
index=_internal
|bin _time span=10m
|stats count as count by _time, sourcetype
This query gives us a list of counts by sourcetype divided into 10-minute bins. Even though we’ll only run this report once an hour, we’ve “binned” the data into 10-minute chunks in case our requirements change in the future.
Remember, you can always “bin” the _time field in future queries to rollup data by larger time spans.
Note: In order to report on data using specific time slices, you must include _time as part of your stats command. If you are working with data that does not include _time, you may create a _time field by adding the following to the end of your query: “|eval _time=now()”
Step 4: Edit the query to utilize a summary-indexing command (an si-* command)
Now that we’ve tested the query, we need to format the query to write a summary index.
We’ll do so by using our choice of the si-* commands. These are commands that Splunk has specifically designed for use with summary indexing.
Note that the following commands are simply “si” versions of other SPL commands:
- sistats
- sitimechart
- sitop
- sirare
- sichart
For our example, we will replace “stats” with “sistats” as shown below:
index=_internal
|bin _time span=10m
|sistats count as count by _time, sourcetype
Step 5: Save and schedule the query
We’ll save our query as a savedsearch using the typical Splunk Web UI navigation:
Settings → Searches, Reports, and Alerts → New Report

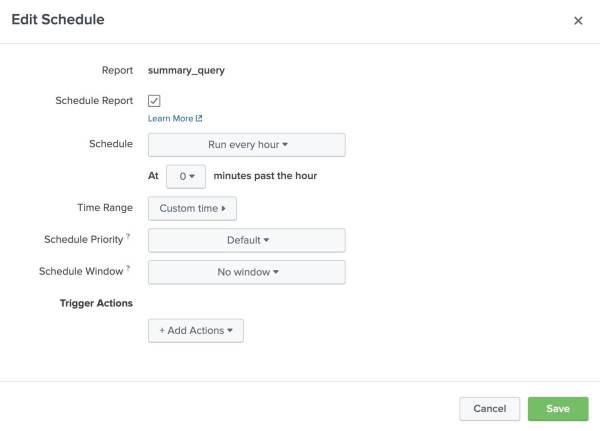
From the reports listing, we’ll schedule the report to run once every hour:
Actions → Edit → Edit Schedule

Step 6: Enable summary indexing
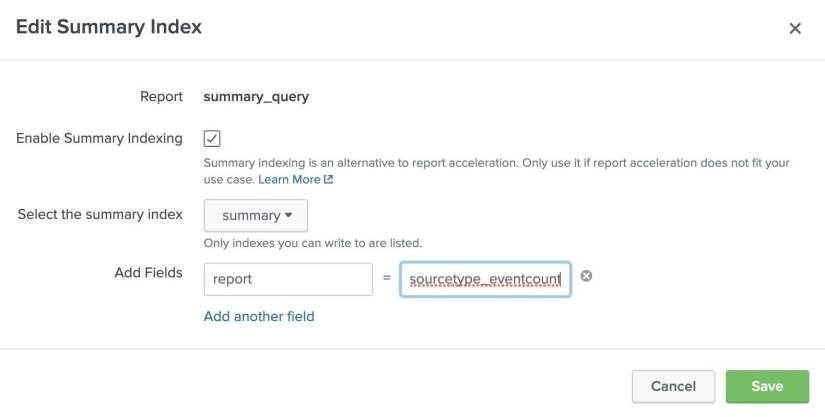
To enable summary indexing, we’ll navigate to the Summary Indexing Dialogue:
Actions → Edit Summary Indexing
In the dialogue box, we will select to store the data in the “summary” index that we chose in step one.
We’ll also add a new field, “report,” to help distinguish data within the summary index from other queries that are developed. The name “report” is arbitrary — you may create your own fields as needed.

Step 7: Develop and test a query used to view the summary index results.
This is the final step: actually running the query that will reveal the final results.
To count today’s number of events per hour, by sourcetype, we’ll create the following query:
earliest=-0d@d index=summary report=sourcetype_eventcount
|bin _time span=1h
|stats sum(count) by _time orig_sourcetype
This query is made up of two parts: the query fields and the resulting fields. Here’s a breakdown of the notable elements of each one:
Query fields
- report: This is the custom field that was added in step six to identify the data. You may use this within the query to pull back the appropriate dataset.
- orig_sourcetype: We are required to query based on a new field, “orig_sourcetype,” to avoid conflicting with the sourcetype that has been assigned to this data (“stash”).
Resulting fields
- source: The source of the data is set to the name of the savedsearch that was executed to populate the index.
- search_name: This is also set to the name of the savedsearch that was executed to populate the index.
- psrsvd* fields: These are special “prestats reserved” fields that Splunk adds whenever you use any of the si* commands. These fields aren’t typically directly referenced, but Splunk uses them when reporting commands like chart, timechart, and stats.
Further Reading
- When setting up the query, ensure that you use a _time field to make use of “stats latest()” functionality. Try to include all fields and granularity that you may need in the future. The best practice, per Splunk, is to use the lowest granularity possible to achieve your goal and perform appropriately.
- Not covered within this article is the manual population of summary indexes using the addinfo and collect commands: https://docs.splunk.com/Documentation/Splunk/8.0.4/Knowledge/Configuresummaryindexes#Manually_configure_a_report_to_populate_a_summary_index
- Consider backfilling data from that past. This can be done via the Splunk CLI and the use of the python script fill_summary_index.py https://docs.splunk.com/Documentation/Splunk/latest/Knowledge/Managesummaryindexgapsandoverlaps#Use_the_backfill_script_to_add_other_data_or_fill_summary_index_gaps
About SP6
SP6 is a niche technology firm advising organizations on how to best leverage the combination of big data analytics and automation across distinct (3) practice areas:
- Cybersecurity Operations and Cyber Risk Management (including automated security compliance and security maturity assessments)
- Fraud detection and prevention
- IT and DevOps Observability and Site Reliability
Each of these distinct domains is supported by SP6 team members with subject matter expertise in their respective disciplines. SP6 provides Professional Services as well as ongoing Co-Managed Services in each of these solution areas. We also assist organizations in their evaluation and acquisition of appropriate technology tools and solutions. SP6 operates across North America and Europe.
